3 kmconvection-permitting mesh
1live peril module (TC)
3GBA storms simulated
GBAlive coverage region
The idea
Risk is not a row in a table. It is a place on a map.
Most catastrophe output arrives as a single loss number for a portfolio. That hides the thing a decision actually turns on: where the hazard lands, how far it reaches, and which assets sit inside the footprint.
Atlas is map-first. Each peril is a layer you can switch on over a real region, read against a calibrated scale, and trace down to the asset. Today one layer is live, built on physics rather than a fitted curve.
The risk map
One region, every storm, layer by layer.
The tropical-cyclone module over the Greater Bay Area. Pick a storm, switch the hazard layer, and read the footprint against its scale. Every map below is an Edgion 3 km simulation, not stock imagery.
ATLAS · GREATER BAY AREA
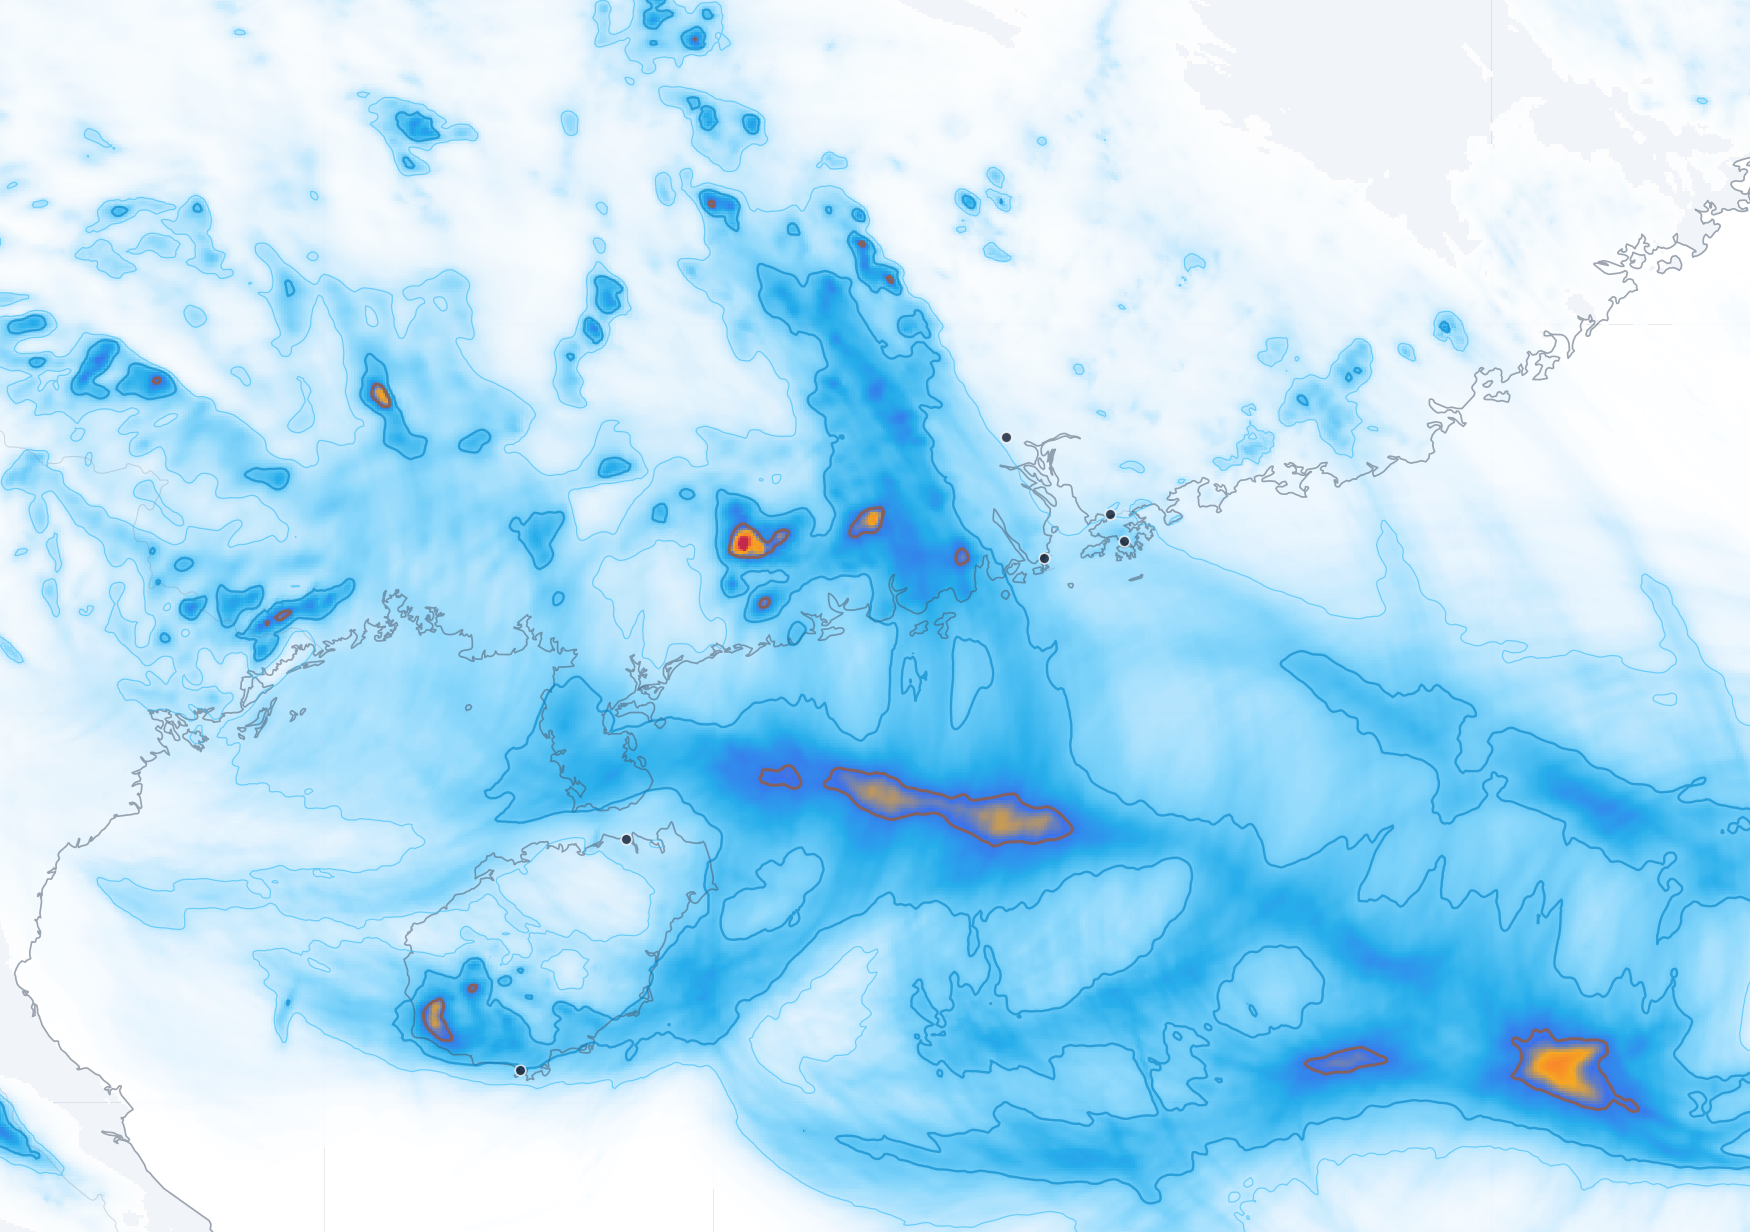
Mangkhut 2018 · 48 h rainfall
99th-pct response
1.83×
vs thermodynamic reference 1.0×
48 h rainfall · ensemble meanmm

025100200400700
0.3member fraction crossing ≥50 mm/hr1.0
Ensemble-mean fields, CPAS 3 km convection-permitting mesh. Rainfall shows 48 h accumulation; flash-flood shows where the warming ensemble crosses the ≥50 mm/hr threshold beyond the historical footprint.
From map to asset
Every footprint resolves to a per-region hazard readout.
Drop a location and Atlas reads the live layers at that place. Where a peril is modelled, the readout carries the real metric and its scale; where it is not yet, the row stays explicitly open rather than guessing a number.
// HAZARD READOUT · GREATER BAY AREAstorm set Mangkhut · Hato · Hagupit
TC rainfall48 h, ensemble mean
0.63–1.83× ref
Flash-floodnew ≥50 mm/hr zone
26.8–92.6k km²
TC windhigh-wind area shift
+10 to +22%
Storm surgecoastal inundation
layer in build
Seismicground shaking
roadmap
Live rows carry the real range across the three simulated storms; roadmap rows are platform layers not yet modelled for this region. Figures are illustrative of the method, not a guarantee for any specific asset.
How it runs
From observed storm to a layer on the map.
01
Ingest
Observed storm track, terrain, and bias-corrected climate state for the region.
02
Simulate
Replay at 3 km on an adaptive mesh; historical and warming controls plus ensemble.
03
Resolve
Extract rainfall, flood, and wind fields as calibrated hazard layers.
04
Map
Render each peril over the region against a documented scale.
05
Read
Score any location inside the footprint and export the readout.
The platform
Built multi-hazard. Honest about what is live.
Live · tropical cycloneRainfall and flash-flood layers over the Greater Bay Area, on Edgion's own 3 km simulations of Mangkhut, Hato, and Hagupit.
One engine, many perilsThe same map, layer, and readout framework carries surge, seismic, and landslide as each peril's physics and data are brought in.
Region by regionThe GBA is the live coverage today. New regions come online as their storm set is simulated and calibrated.
// note: Atlas is a map-first platform with one live peril module (tropical cyclone) over the Greater Bay Area. Layers shown as roadmap are not yet modelled and carry no result figures. Live maps are Edgion 3 km storyline simulations; they are physics-based stress tests of how past storms could reorganise under warming, not forecasts of specific future events, and are illustrative rather than a guarantee for any individual asset.